Overview
- Annual UK house price inflation at +0.6%
- 60% with over £300k price cutting asking prices by 5% to attract demand
- Annual price falls of up to -2.2% concentrated in southern England on markets with an average price over £300,000
- Other areas of England registering annual house price inflation of over 3.5%
- Buyer demand down 18% in last two months due to mortgage rates
- Rates peaking and already signs of dropping back closer to the 4% region
- Likely to be the southern areas seeing price reductions throughout second half of the year with northern areas performing well
- UK markets till on track to be down by 5% end of year
- Mortgage decreased down to 4.99%
- 80% of markets with an average price over £300k registering modest price falls
Isle of Wight property market update
- Majority of sales completed over the last year are detached homes
- The market has decreased by 0.35% since July
- Detached homes are on an average of £569,000 and have seen a fall in 1.9%
- Semi-detached homes are on an average of £334,000 and have seen an increase in 1.5%
- Terraced homes are on an average of £227,000 and have seen an increase of 1.1%
- Flats and apartments are on an average of £189,000 and have decreased in 2.1%
Mortgage rates drop
Rates have dropped on the 11th of August, as the price war between the bigger lenders continue. The best rate available today (according to better.com) is 4.99%, which is 0.73% lower than the start of the week.
Remember, mainstream media will push the narrative they want to drive. The reality is, lenders make money by lending.
This drop in rate shows that the big lenders believe the bank of England rate may have peaked.
18% Drop in demand due to mortgage rates
During the first six months of 2023 the demand recovered as the mortgage rates fell towards were around 4%, supporting an increase in new sales. Mortgage rates rising quickly over the last six weeks towards 6% has reduced buying power and demand, which has fallen by 18% over the last two months.
The decline in demand is lower than that of the mini-budget in 2022 or when the first lockdown was introduced. Demand is currently 6% weaker than 2019 levels. Sales agreed are only 17% lower year-on-year and we are seeing more committed buyers in the market.
Property price inflation +0.6%
Lower demand and an increase in supply has slowed house price growth to +0.6%, which is down from +9.6% middle of 2022.
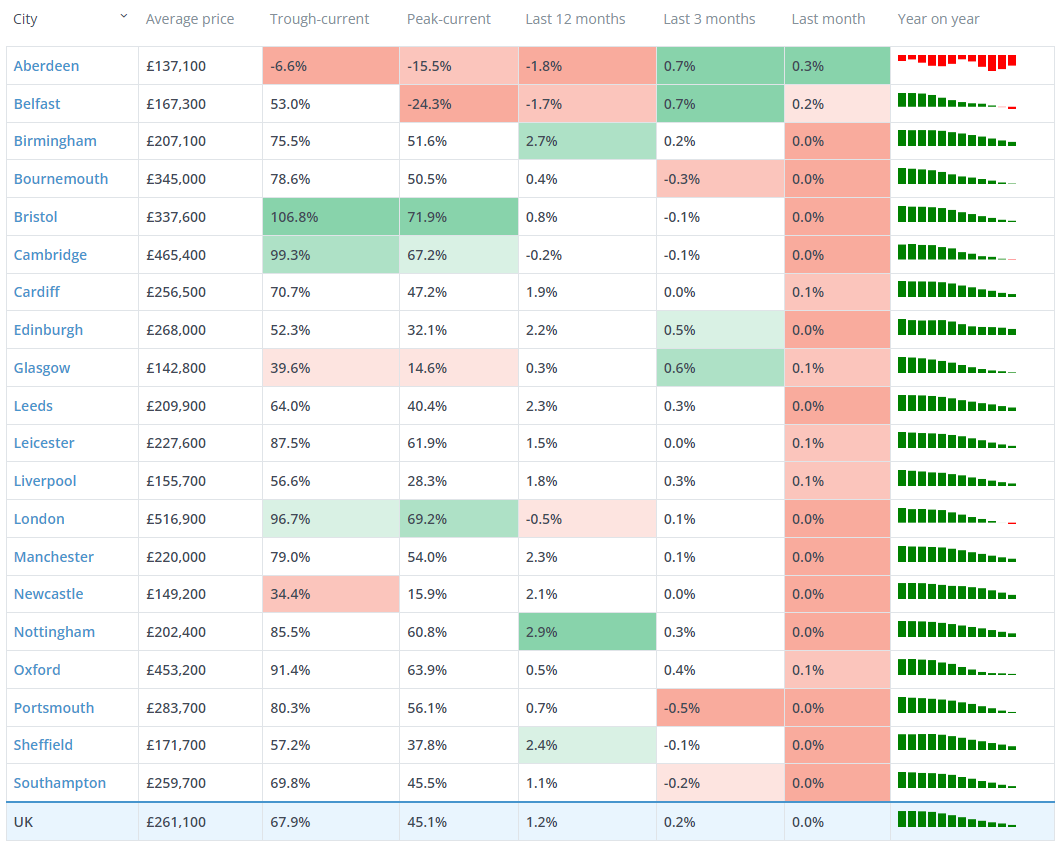
There is a clear split between trends in southern England and the rest of the country. With higher mortgage rates having an impact on buying power in the southern areas, where the house prices are the highest.
House prices are falling by up to -0.6%, year-on-year, across all four regions in southern England. However, across the other seven regions of the UK, they are registering +1% growth compared to one year ago.
It’s likely that the price growth between the south and rest of the country will continue to widen over the latter part of 2023. It’s realistic to expect the more affordable markets to not register any price drops in 2023.
Check out the latest property price index:

Over £300,000 properties are most likely to fall
As you can see It’s become clear that the property markets in the UK averaging over £300,000, are feeling the impact of higher mortgage rates than other areas. The chart below shows annual price growth compared to average house prices for 121 UK postal areas in June 2023.


